
By Terry Yaremchuk
After almost a month of a strengthening US dollar index, it appears that an interim top has been reached.
The Dollar Index was halted in its tracks right at that congestion zone, indicated by the yellow highlight band. Further confirmation is indicated by Relative Strength Index (RSI) breaking down out of overbought territory, in conjunction with Moving Average Convergence Divergence (MACD) curling negative, as noted by the blue circles. A probable near term target is the convergence of support lines at 96.
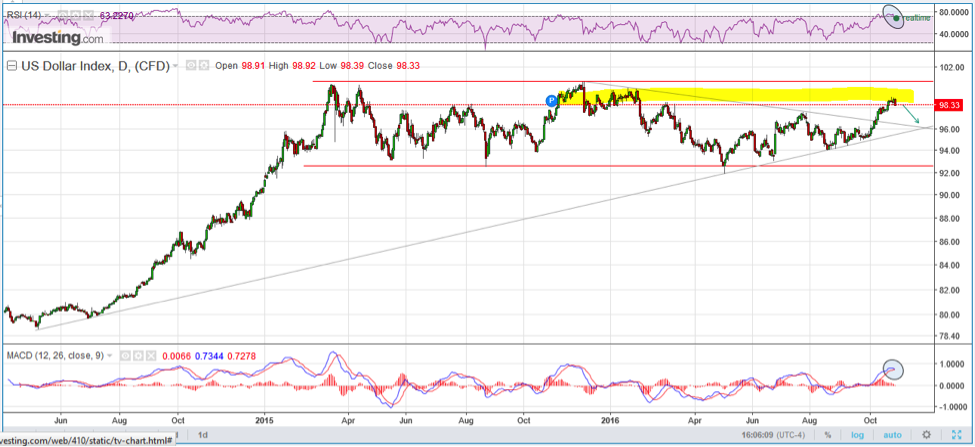
Source: investing.com, Oct. 28, 2016
Where it goes from there is uncertain, but a breakdown below support would bring 94 and 92.50 respectively into the crosshairs. This would violate a long-standing uptrend line and would be possibly bearish for the US dollar.
Bears would be emboldened and attempt an all-out assault on the horizontal support at 92.50 which is THE critical maginot line. Violation of this support would signal that a significant correction is underway for the US dollar.

Because of the inverse relationship between the dollar and various commodities, this would put a wind in the sails of commodities such as oil and precious metals. Alternatively, a bounce off of support would suggest that the status quo is in effect and that the trading range should remain in the 96 to 99 range with an upward sloping bias and negative implications for commodities.
Silver update for the week ended Oct. 28, 2016
Since breaking support at $18.50, silver has washed out with a capitulation bottom near $17.00 and has been consolidating over the last two weeks in a sideways trading range between $17.40 and $17.80. It is very typical for a correction to run what is known as an ABC correction where A to B is the first down leg, then a period of digestion and then an equivalent B to C down leg. By implication, this would suggest that the silver correction is still at the midway point and there still could be considerable downside.
It’s never so straightforward, however, and there are mixed signals flashing. The orange dashed line indicates that MACD is losing momentum and as it rolls over, so too should price, but it is so close as to suggest that maybe the line gets violated and we actually are on the verge of a major reversal. RSI, as well, is far from overbought, suggesting further strength could push the price higher.
This is where it gets tricky, and what I think is imminent is actually a short covering squeeze that propels price up towards $18.50 where horizontal and diagonal resistance lines converge and sucks a whole mess of buyers in and THEN the B to C leg kicks in with $16 as the downside target.
Connect with our Featured Silver Stocks to receive the latest news and investor presentations.
Â
If I am wrong and those mixed signals are telling a different story, then the bottom is already in and once $18.50 is violated to the upside, it’s game on for silver. I’ll believe it when I see it.
What about gold?
Gold paints a similar picture to silver. The near term resistance for gold is $1,300 and the downside target of leg B to C would be $1,200.
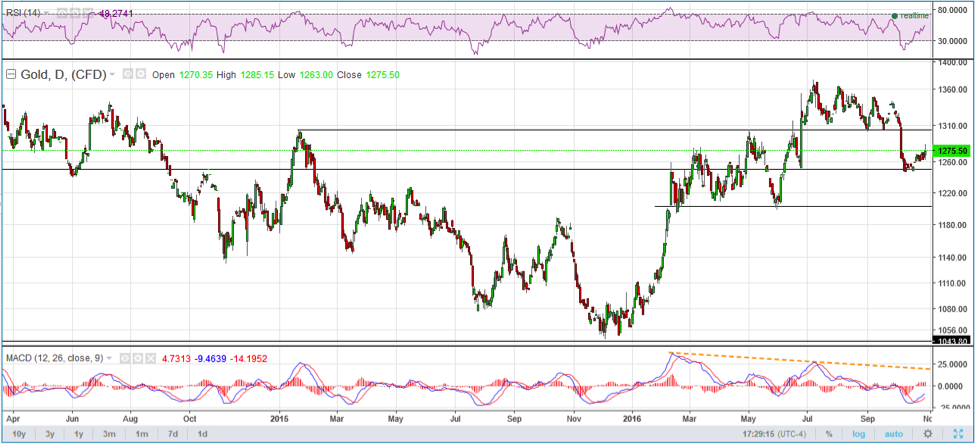
Source: investing.com, Oct. 28, 2016
Â
Terry Yaremchuk is an Investment Advisor and Futures Trading representative with the Chippingham Financial Group. Terry offers wealth management and commodities trading services. Specific questions regarding a document can be directed to Terry Yaremchuk. Terry can be reached at tyaremchuk@chippingham.com.
This article is not a recommendation or financial advice and is meant for information purposes only. There is inherit risk with all investing and individuals should speak with their financial advisor to determine if any investment is within their own investment objectives and risk tolerance.
All of the information provided is believed to be accurate and reliable; however, the author and Chippingham assumes no responsibility for any error or responsibility for the use of the information provided. The inclusion of links from this site does not imply endorsement.Â
Â
The post US Dollar Outlook: A Significant Correction Underway? appeared first on Investing News Network.
Leave A Comment
You must be logged in to post a comment.